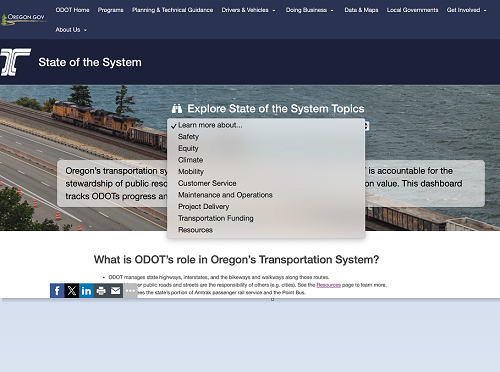
The Oregon Department of Transportation has created an online “State of the System” dashboard to highlight the department’s activities, goals, and progress in areas such as safety, equity, and mobility.
[Above image by the Oregon DOT]
Visitors to the dashboard can view information on how many tons of salt Oregon DOT uses on roads, the average evening drive speed on major highways, the value of contracts granted to disadvantaged business enterprises, average wait time to get a driver’s license, and hundreds of other data points.
The amount of information is massive but neatly organized into eight areas: safety, equity, climate, mobility, customer service, maintenance and operations, project delivery, and funding. The areas reflect the categories of the Oregon Transportation Plan – the department’s policy document – and the Oregon DOT Strategic Action Plan.
Like other state departments of transportation, Oregon DOT accumulates a lot of data, “but we didn’t have a centralized way to share it with people,” explained Matt Noble, a communications specialist with the agency.
“The bicycle and pedestrian folks saw the data they were interested in, but they didn’t get to see data from other sources,” he said. “It also was important for us to make sure it’s easy for people to understand.”
Each area has its own page that includes charts, graphs, photos, interactive maps, and links to programs, projects, and reports for those who want to take a deeper dive on specific subjects. For example, the climate page has detailed information on greenhouse gas emission measurements, electric vehicles, construction emissions, and how ODOT prepares for and responds to severe weather events.
While the department shares its successes on the dashboard, it doesn’t shy away from areas in which it believes it could do better. In the customer service category, the department says it is “wrestling with operations and maintenance budget shortfalls, reductions in customer-facing staff, retaining a skilled workforce and being a competitive employer.”
While many state departments of transportation – including Arkansas, Colorado, Delaware, and Virginia – have online dashboards, Oregon DOT’s “State of the System” dashboard seeks to open the bulk of ODOT’s activities to the public, not just metrics on project delivery, budgets, and road congestion.
The dashboard gives the public an appreciation of the variety and sheer breadth of ODOT’s reach beyond building and maintaining roads and bridges. The site includes information on customer surveys, the biking and walking network, preventing vehicle-wildlife collisions, public transportation, the electric vehicle charging infrastructure, and much more.
Showing the public that broad responsibility was another impetus in creating the dashboard, Noble said.
“We’ve noticed over the years that people in Oregon don’t have a good handle on the scope of things we do, and frankly, that’s not their fault,” he said. “We have to do a better job of telling the department’s story, and that’s one of the things we are trying to do with the dashboard.”
 Environmental Policy


